
The solar vs generator cost question has one honest answer: it depends on how many hours a year the backup system runs, and how much energy it delivers in them. That combination is the system’s duty profile, and it decides the winner. The cheap-to-buy, costly-to-run option wins one duty profile; the costly-to-buy, cheap-to-run option wins the other. This guide compares the two as fixed backup installations: a fuel generator on one side, a solar array with battery storage and an inverter on the other. Portable power products are a different class and stay out of scope.
It is written for distributors, importers, EPC teams, and commercial buyers specifying backup power in markets where outages are frequent or diesel is expensive. It stays out of homeowner whole-house territory. The off-grid procurement guide places this decision inside the larger line-building sequence, and the power-flow explainer covers how the solar side actually works.
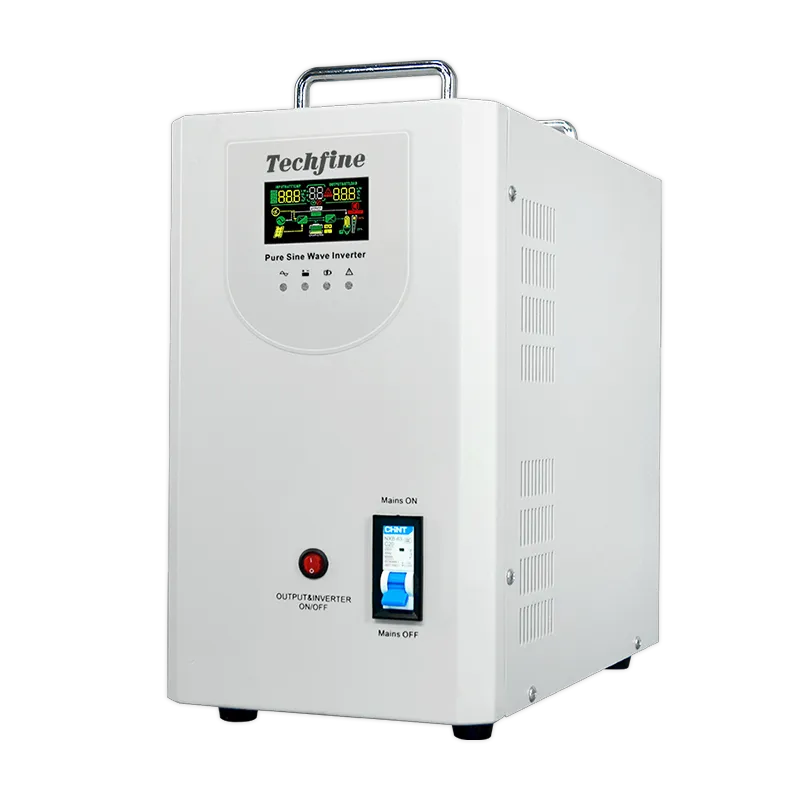
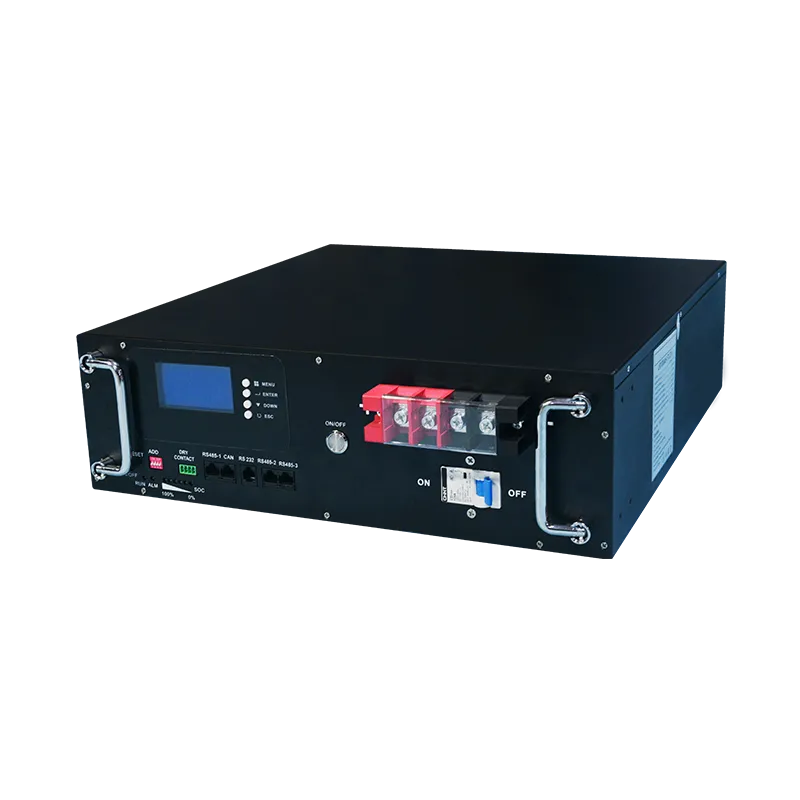
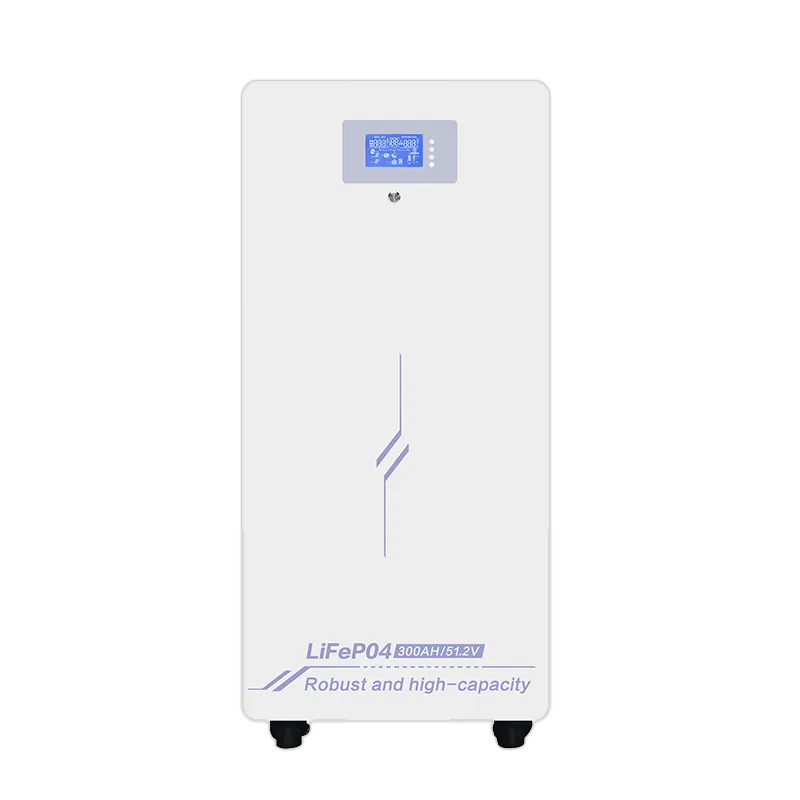
We make the solar and storage side of this comparison — the off-grid inverters, charge-control platforms, and battery products of Guangdong Techfine Electronic Co., Ltd. We do not make generators, and that is the reason the generator arithmetic below gets the same rigor as the solar arithmetic. Every worksheet value in this article is a labeled assumption you can replace with your own. We quote no prices of our own on this page.
Key Takeaways
- Annual utilization decides the comparison: a generator that runs a few hundred hours a year usually has the lower ten-year total; daily cycling flips the verdict, because fuel then dominates the total.
- Across the developing world, generators serve an estimated 20–30 million sites, and annual spending on generator fuel runs to roughly $50 billion (IFC, 2019).
- Compare five cost lines on each side — purchase, installation, fuel, service, replacement — against your annual backup energy. At our labeled assumptions the two ten-year totals cross near 1,000 kWh per year.
- The generator can still be the right call: very low utilization, very large starting loads, or no room for an array keep fuel rational. Run the worksheet before deciding.
- On the storage side, the replacement line is cycle arithmetic: our LiFePO4 battery lines are rated at 5,000 cycles or more, so at one cycle a day the ten-year count sits inside the rating. The worksheet labels that $0 a cycle-count result; warranty and operating conditions still govern.
- Set your three inputs — daily backup energy, outage pattern, local fuel price — before comparing any supplier’s quotation.
Solar vs Generator: The Short Answer
Two cost structures answer this question. A generator spends little to enter and keeps spending to run: the purchase is modest, and each delivered kilowatt-hour carries a fuel and service charge. A solar-and-battery system spends heavily to enter and almost nothing to run: sunlight carries no invoice, and the moving parts are few. Ten years of that difference is what the worksheet measures.
Which structure wins depends on how hard the system works. At low annual utilization — grid failures a few times a month — the generator’s modest purchase price is not overtaken by its running costs within the decade, and it finishes cheaper. At daily cycling, the accumulating fuel line overtakes the solar system’s higher purchase price within a few years. At the labeled assumptions in our worksheet, the two ten-year totals cross near 1,000 kWh of delivered backup energy per year, roughly 2.7 kWh per day.
The rest of this guide makes that verdict computable for your market: the purchase lines, the running lines, the worksheet with its assumptions exposed, and the decision rules — including the cases where we would tell you to keep the generator.
What Each Option Costs Up Front
Both purchase prices are stacks, not single numbers. Reading them as stacks is what makes two quotations comparable.
The generator stack: the unit itself, the transfer switch that moves the load onto it, and the installation — wiring, exhaust, fuel tank and plumbing, a base, and commissioning. The solar-and-battery stack: the array, the inverter or hybrid inverter-charger, the battery bank, and the balance of system — mounting, cabling, protection, and enclosures.
Two structural differences follow. The generator is sized to two checks together — concurrent running load, and starting or surge demand with its duration — plus temperature and altitude derating and headroom. The solar side sizes its bank to the energy a day of outage removes, and its array to recharging that bank. That sizing arithmetic has its own guides — the system calculation walkthrough and the battery bank sizing method.
The storage line of the solar stack fell sharply in 2025. Stationary-storage packs dropped to $70/kWh in BloombergNEF’s 2025 annual survey, 45% lower than 2024 (BloombergNEF, 2025). That figure is a survey-level benchmark: an order-of-magnitude reference for how the storage line has been falling. It is not a small-kit price, and it is not a quotation.
What a distributor actually pays for the goods, from the factory term to the warehouse, is a separate model with its own guide: the landed-cost breakdown.
For the worksheet below, each purchase line carries a labeled assumption rather than a market price. The generator assumption is $3,000 for a 3.5 kW class diesel set with transfer switch, installed for $800. The solar assumption is $6,000 for the kit — array, inverter-charger, and a 12.5 kWh LiFePO4 bank — installed for $1,200. Your market’s numbers replace ours; the structure is what the comparison needs.
The Running Costs: Fuel, Maintenance, and Replacement
The recurring lines decide the decade. Three of them matter, and each is arithmetic you can check.
Fuel. A diesel generator’s fuel use is measured in liters per kilowatt-hour — its specific fuel consumption — and commonly sits between 0.25 and 0.35 L/kWh across the 70–100% load band. Annual liters equal annual delivered kilowatt-hours multiplied by that figure; annual dollars equal liters multiplied by your pump price. The line scales directly with outage hours: twice the hours, twice the fuel.
Service. Diesel sets commonly take a service every 250–500 run-hours — oil, filters, checks — and a standby unit takes at least one per year regardless of hours. A decade of heavy running adds an overhaul reserve; the worksheet prices it per 10,000 run-hours. The solar side carries no fuel line and a small service budget: inspection, torque checks, cleaning.
Replacement. The generator’s late-decade question is the overhaul; the solar side’s is the battery. The battery question is cycle arithmetic, and the rating is on the datasheet: our LB-series, LC-series, and LR-series lines, for example, are rated at 5,000 or more cycles at standard charge and discharge. Annual cycles equal annual delivered energy divided by usable bank energy.
At one full cycle a day — 365 cycles a year — a ten-year worksheet asks 3,650 cycles of the bank, inside that rating, so the model schedules no replacement. Read that as a cycle-count result, not a calendar-life promise: the rating holds at standard charge and discharge, and warranty terms, operating temperature, actual depth of discharge, and charge rate are the conditions a real schedule answers to. At two cycles a day the math changes, and the bank sizing guide works the derivation.
The 10-Year Worksheet: Two Duty Profiles
Run your own numbers into five cost lines per option — purchase, installation, fuel, service, replacement — under two duty profiles. Each value below is a labeled assumption at a 2026 baseline; change any of them and the totals move.
The two profiles:
- Occasional outages — 20 failures a year, 5 hours each, 3 kW average load: 300 kWh per year, 100 run-hours.
- Daily cycling — 10 kWh of backup energy each day at a 2.5 kW average load: 3,650 kWh per year, about 1,460 run-hours.
The average load is the link between delivered energy and run hours; it is declared because the generator’s service schedule counts hours, not kilowatt-hours. The common assumptions:
- Generator: 3.5 kW diesel set — $3,000 with transfer switch, $800 installed.
- Fuel: 0.30 L/kWh specific fuel consumption; diesel at $1.10 per liter.
- Service: $40 per interval; interval count rounds up per 250 run-hours, minimum one per year; the solar side $60 per year.
- Overhaul: a $1,500 reserve per 10,000 run-hours — the daily profile’s ≈14,600 decade hours book one, the occasional profile’s 1,000 book none.
- Storage: 12.5 kWh LiFePO4 nameplate at 80% depth of discharge gives 10 kWh usable — one full cycle per day of daily-profile duty.
- Solar kit — $6,000, $1,200 installed — with the array sized to recharge the daily throughput plus losses at the site’s solar resource; the system calculation guide owns that sizing method.
Daily-cycling profile, ten-year totals:
| Cost line | Generator | Solar + battery |
|---|---|---|
| Purchase | $3,000 | $6,000 |
| Installation | $800 | $1,200 |
| Fuel, ten years | $12,045 | $0 |
| Service, ten years | $2,400 | $600 |
| Replacement | $1,500 (overhaul reserve) | $0 (cycle-count result; conditions above) |
| Ten-year total | $19,745 | $7,800 |
The visible arithmetic:
- Fuel: 3,650 kWh × 0.30 L/kWh = 1,095 L per year; 1,095 L × $1.10 = $1,205 per year; × 10 = $12,045.
- Service: 1,460 run-hours ≈ six 250-hour intervals per year; 6 × $40 = $240 per year; × 10 = $2,400.
- Solar replacement: 3,650 cycles in ten years against a 5,000-plus rating — none scheduled.
Occasional-outage profile, ten-year totals:
| Cost line | Generator | Solar + battery |
|---|---|---|
| Purchase | $3,000 | $6,000 |
| Installation | $800 | $1,200 |
| Fuel, ten years | $990 | $0 |
| Service, ten years | $400 | $600 |
| Replacement | $0 (1,000 run-hours) | $0 (cycle-count result) |
| Ten-year total | $5,190 | $7,800 |
Each value in the chart is a labeled assumption at a 2026 baseline; the totals and the crossover point are model outputs at those assumptions, not quotations.
Where the verdicts sit: the occasional-outage profile finishes $2,610 in the generator’s favor; the daily-cycling profile finishes $11,945 in the solar side’s favor. Between those profiles the totals cross once, and the arithmetic is reproducible. The service rule steps with run hours, so each crossover below is solved inside its own interval band.
Above 625 up to 1,250 kWh per year at 2.5 kW, the generator runs two service intervals a year; its ten-year total there is $4,600 plus $3.30 per annual kWh. Setting that equal to the solar side’s flat $7,800 crosses at roughly 970 kWh per year — near 1,000. The overhaul reserve enters at 10,000 run-hours in a decade, which is 2,500 kWh per year at this load, so no crossover band reaches it.
Sensitivity, same profile pair:
- Fuel price ±50%. At $0.55/L the daily-cycling generator totals $13,723; at $1.65/L, $25,768. The ordering holds across the whole band — duty profile dominates fuel price. The occasional-outage generator moves between $4,695 and $5,685 and keeps its lead. The crossover itself travels across the band, from roughly 650 kWh per year at $1.65/L to roughly 1,700 at $0.55/L, where three service intervals apply.
- One bank replacement. Scheduling one storage replacement in the decade, at a $2,000 assumption, lifts the solar total to roughly $9,800 at the daily profile; the ordering holds there. The crossover moves up to roughly 1,450 kWh per year, again at three intervals.
- Discounting. At an 8% discount rate the ten-year fuel line’s present value falls from $12,045 to about $8,086, and the generator’s discounted total to roughly $14,400 against the solar side’s $7,600. Discounting narrows the gap; it flips neither profile.
When Each One Wins — and Where Hybrid Fits
Three outcomes exist, and each fits a different site. Below roughly 1,000 kWh per year of delivered backup energy at our assumptions, the generator wins on cost and is the defensible specification. At daily cycling, the solar-and-battery system wins, and the gap widens with each outage hour. Between the two, the decision moves to site facts.
The generator keeps three honest advantages. Very large starting loads — a compressor or a pump that draws several multiples of its running power — force a much larger inverter and bank on the solar side, while a generator rated for the surge with headroom absorbs them. Sites without roof or ground area for an array have no solar option. And fuel logistics that are genuinely cheap and reliable keep the fuel line low.
Against those, weigh the non-cost factors the dollars do not carry: noise, exhaust outside a window, and fuel handling are real decision inputs for many sites, and they are outside this article’s money axis.
The third outcome is hybrid: a solar-and-battery system sized for the daily cycle, with a generator held for the long tail — cloud-heavy weeks, maintenance days, the rare long outage.
The inverter layer makes this topology practical. A hybrid inverter-charger accepts the generator on its AC input and manages both sources; our ZA Series hybrid solar inverters, for example, pair 3/4 MPPT photovoltaic inputs with an AC input on one platform. A battery inverter with AC charging fills the same management role in a two-box build; our HB-series, for example, signals the generator to start automatically when the bank runs down. The design sequence — which loads are critical, how much autonomy, which transfer arrangement — is the backup-power design guide, and the hybrid inverter explainer covers the platform choice.
The Diesel-Displacement Case in Emerging Markets
Across the developing world, the backup-power economy runs on purchased fuel. Generators serve an estimated 20–30 million sites, and annual spending on generator fuel runs to roughly $50 billion — the scale of the spend this comparison moves (IFC, 2019). The same study separates one regional finding: in much of Sub-Saharan Africa, more is spent on generator fuel than on maintaining and managing the national grid itself.
Policy keeps repricing that fuel line. The IEA’s Africa Energy Outlook records that the 2022 price spikes risked doubling energy-subsidy burdens in African countries, and that Egypt, Ethiopia, and Uganda were driven to halt or reduce subsidies or reinstate fuel taxes (IEA, 2022).
What the outlook documents is the subsidy pressure itself; it does not track diesel at any pump. Whether a given subsidy cut reaches your pump price is a local fact, and the worksheet already takes your price as its input — that is where the repricing lands. No hardware line on the solar side moves with it.
For a distributor or importer, that mechanism is the product-line argument. The buyers are commercial and industrial sites, telecom and mining camps, and the installers who serve outage-heavy markets. For each of them, the strongest local input is the fuel log already on file: it prices the generator’s largest recurring line at this site, this year.
FAQ: Solar vs Generator Cost
Which is better for backup power, a generator or solar?
Neither is better outright; annual backup energy decides. A generator kept for occasional failures finishes a decade cheaper, because at that duty its running costs stay small against the purchase price. A system cycled daily finishes cheaper on the solar side because the fuel bill accumulates year after year. The crossover sits near 1,000 kWh per year at the labeled assumptions.
One line keeps moving in the solar side’s favor: stationary packs dropped to $70/kWh in 2025, 45% below 2024 (BloombergNEF, 2025) — a survey-level benchmark for the purchase trend, not proof for any duty profile. The backup-power design guide places the choice inside the full design sequence.
How many hours of backup per day before solar beats a generator?
At our assumptions, the two ten-year totals cross near 1,000 kWh per year of delivered backup energy — roughly 2.7 kWh per day, about 1.1 hours a day at the declared 2.5 kW average load. Below that level the generator leads; above it the solar side does. Fuel price moves the crossover itself — roughly 650 kWh per year at $1.65/L, roughly 1,700 at $0.55/L — while flipping neither profile’s verdict. The bank sizing that sets the solar side’s kilowatt-hours is its own method (battery bank sizing).
Is a solar battery backup cheaper than a diesel generator?
On purchase price alone, no — the generator enters cheaper. On ten-year total at daily duty, yes, decisively. The worksheet’s generator spends $12,045 on fuel across a decade of one-cycle-per-day duty. The solar side’s replacement line is $0 in the model: 3,650 cycles sit inside the 5,000-plus rating — a cycle-count result, not a calendar-life promise. The battery sizing guide derives the usable-capacity arithmetic behind that figure.
What size generator or battery system do I need for backup?
Size the generator to two checks together — concurrent running load and starting demand with its duration, plus derating headroom; size the solar side to the energy a day of outage removes. The first is a load audit, and both have their own arithmetic: the system calculation walkthrough covers daily kilowatt-hours, autonomy days, and depth of discharge, and the bank sizing guide works the battery line.
The Short Version for Buyers
Match the architecture to the duty. At a few hundred run-hours a year, the generator has the lower ten-year total. At daily cycling, the solar-and-battery system has the lower total, and by a wide margin. The comparison is five lines on each side — purchase, installation, fuel, service, replacement — run against your annual backup energy. At our assumptions the crossover sits near 1,000 kWh per year, and each input is labeled for replacement with your own numbers.
Two readings follow. For your own sites, the worksheet above is the model: set the three inputs and let the totals decide. For the market you sell into, the fuel line is where policy and outages land first, and it reprices faster than any hardware line on the other side of the comparison.
The figures cited here are third-party (BloombergNEF’s survey, the IFC generator study, the IEA outlook); the worksheet values are our own assumptions, and none is a Techfine price. Tell our team your backup-energy need, outage pattern, and target market, and we will review your case with you and clarify the next specification step.
Sources
- BloombergNEF — Lithium-ion battery pack prices fall to $108 per kilowatt-hour, despite rising metal prices (Dec 9, 2025) · retrieved 2026-08-31
- IFC, with the Schatz Energy Research Center — The Dirty Footprint of the Broken Grid (Sep 18, 2019) · retrieved 2026-08-31
- IEA — Africa Energy Outlook 2022, key findings · retrieved 2026-08-31